
Data Visualization
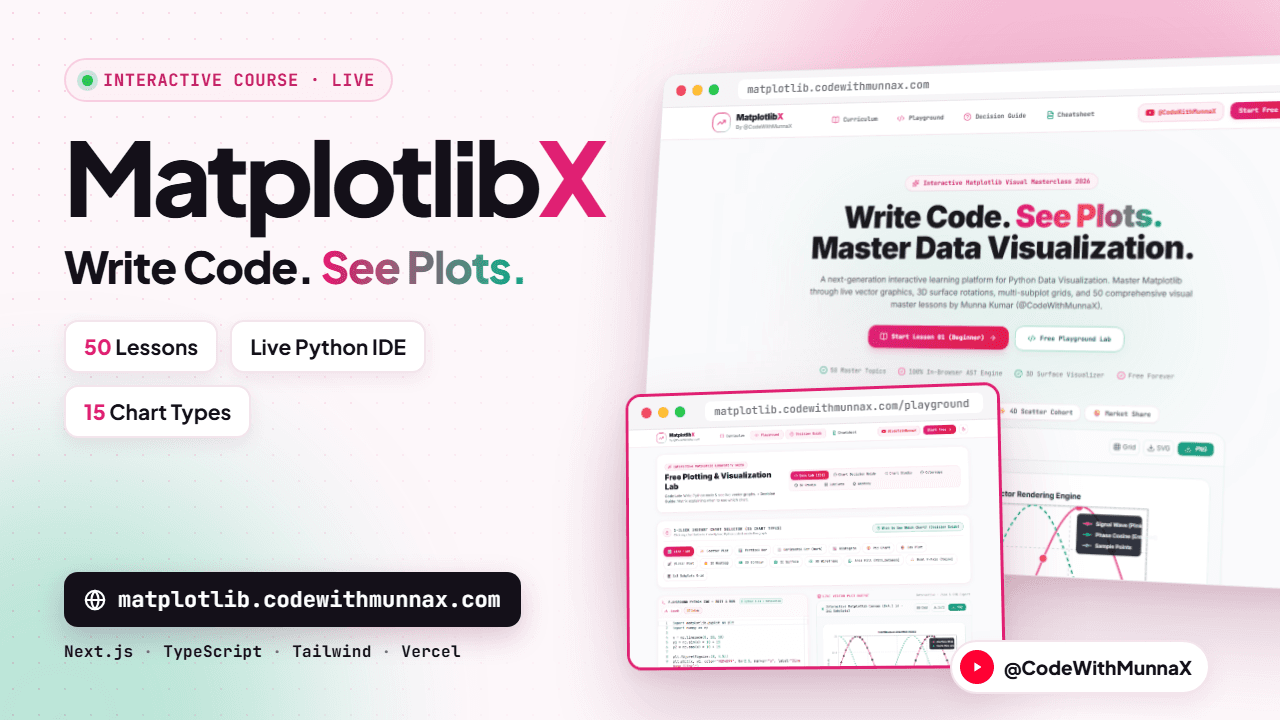
MatplotlibX: Learn Data Visualization with Live Plots
An interactive Matplotlib course with 50 lessons and a live in-browser Python IDE: write code, see the plot instantly, and master 15 chart types including 3D surfaces.
- Next.js
- TypeScript
- Tailwind CSS
- Vercel
Case study